


Image Source: unsplash.com
Bot attacks use automated software to carry out malicious or fraudulent actions on websites. Common targets include servers and APIs, and they operate at speeds and levels of sophistication humans simply can’t match. Perhaps the bigger issue now is that more sophisticated attacks use browser automation designed to behave much more like a real user.
The consequences for businesses are huge. From stealing growth potential and ROI, as well as wasting ad spend, severe financial loss is compounded by damaged customer trust and crippled operational performance is becoming all too common.
To better understand bot attacks in 2026, we’ve drawn on DataDome’s annual bot traffic and threat trends.
The Top Bot Attack Statistics From 2026
Bad bot traffic, AKA the bots making targeted attacks, grew by 124% YoY between July 2025 and June 2026. With that traffic increase came a massive rise in the types of attacks they performed. Scraping, for example, increased by over 185.2% and accounted for 70.9% of bad bot traffic.
Scalping, which is automated software programs that race humans to buy high-demand, limited-edition items online, increased by 290.7%. If you’ve ever tried to buy a concert or event ticket, waited in a queue for hours, and found the tickets sold out when you got to the end, imagine how many bots were ahead of you. That said, despite the increase, scalping bots accounted for only 0.2% of total bad bot traffic.
Spamming, which includes high volumes of fake ads or malicious data across platforms, among others, increased by 44.9%. It represented 7.9% of bad bot traffic. DDoS attacks are also rising, accounting for 12.7% of internet bad bot traffic and peaking at an almost unbelievable 2+ billion requests in one day in April 2026.
Fake account creation grew 34.5% YoY, and credential stuffing grew only 1.1%, but it still represented 6.7% of bad bot traffic.
The smallest categories were payment fraud and vulnerability scanning bots at 0.5% each of the total bot traffic.
Why Bot Traffic Growth Rates Don’t Tell the Full Story
Those are the numbers from DataDome, and what you can see is that growth rate and total volume are very different things. Scalping, for example, grew exponentially but represented only 0.2% of total bot traffic. Scraping grew more slowly, but according to their report, it made up 70.9% of total bad bot traffic.
Because DataDome is deployed downstream of the CDN layer, it analyzes only traffic that passes through, not the full origin request volume. The automated traffic figures reported in this study therefore represent a conservative lower bound. Real-world bot traffic rates across the internet are likely higher than what this data reflects.
They also found that total traffic across all its customers grew by 23.7%, while human traffic grew by 13.2%. Automated categories significantly outpaced both figures. Bad bot traffic grew by 124.0%, more than 9x the rate of human traffic growth. AI traffic grew by 82.3%, over 6x the rate of human traffic growth.
Bad Bot Traffic vs. Good Bot and Human Traffic
The bigger issue now is that traffic can no longer be sorted into “human = good, bot = bad.” AI agents act on behalf of real users, while bad bots mimic humans. The useful question is what a visitor is trying to do and whether that benefits the business. That said, the traffic split from the The report is interesting:
- Human: 73.4%
- Bad bots: 15.4%
- Good bots: 9.9%
- AI agents: 1.3%
Growth is even more interesting:
- Bad bots: +124%
- AI traffic: +82.3%
- Total traffic: +23.7%
- Human traffic: +13.2%
- Verified bots: +1.3%
What we’re seeing is that humans still generate most traffic, but automated traffic is growing much faster. And the human share is falling. Human share sat at 77.9% in July 2025 and dropped to 70.7% in February 2026. Bad bots went from 9.9% to 20.3% over the same period.
It’s better to focus on the real issues: web traffic composition is changing.
Scraping is the clear volume problem: more than seven in every ten bad bot requests detected belonged to that category.
They link the scraping increase partly to the proliferation of automated scraping tools and the rising demand for data harvested at scale, increasingly to feed AI model training pipelines. Unlike scraping, which surged and partially corrected, DDoS showed a more consistent upward trajectory, suggesting structural growth rather than campaign-driven spikes.
Some of the figures are also somewhat misleading. For example, credential stuffing −1.1% looks not so bad without context. Volume surged through summer 2025, then fell almost 90% over three months, before fully recovering and hitting new single-day highs in April 2026. That proves an attack category can be virtually flat YoY while still creating extreme short-term attack periods. Annual growth figures alone don’t describe attack behavior very well.
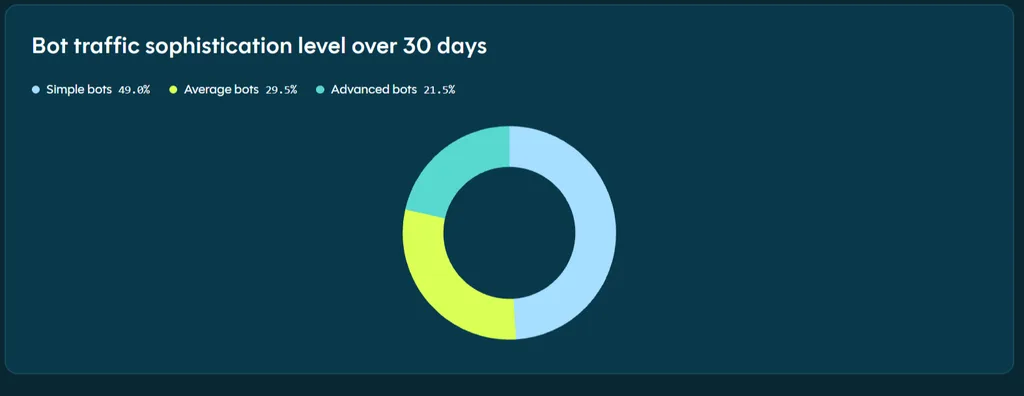
Image Source: DataDome
How Sophisticated Are Bot Attacks in 2026?
Some are highly sophisticated; most are simple.
Most bot defenses are built to stop the obvious: simple automated scripts that don’t try to hide their identity. The question is how much of today’s attack traffic is actually obvious and how much has moved beyond simple detection.
They classified a sample of bad bot traffic by sophistication level, based on the detection signals each request triggered. The analysis covers over 1.5 billion bad bot requests over 30 days in 2026. Because this classification methodology is new this year, there is no prior-year comparison.
The classification instead was broken down as:
- Simple bots: 49.0%
- Average bots: 29.5%
- Advanced bots: 21.5%
Simple bots still dominate. The largest share of bot traffic, 49%, comes from bots that do not try to hide their automated nature. These bots trigger WebDriver signals, a fingerprint exposed by Selenium and basic ChromeDriver automation.
They are among the easiest types to detect. Yet as Part 3 of this report shows, simple bots evade detection on an average of 88.6% of websites. Attackers keep using them because they still work.
Average-complexity bots account for nearly 1 in 3 bad bot requests. This tier uses browser automation frameworks — primarily Playwright and Chrome DevTools Protocol (CDP) — that more convincingly simulate legitimate browser environments.
These tools expose subtle fingerprints in the JavaScript environment that are detectable, but require more sophisticated analysis than WebDriver detection alone. Playwright-based bots are widely used in scraping campaigns, fake account creation, and credential testing.
21.5% of sampled bad bot traffic was advanced enough to engage with active challenges. This segment represents payload forger activity: automated requests designed to bypass security challenges and evade anti-detection controls. They detected this behavior using WebAssembly (WASM) and Virtual Machine signals.
DataDome’s bad bot attack statistics show this is far more than a few bad bots. Automated traffic is growing rapidly compared to human traffic, and even relatively simple attacks are evading detection.
The issue isn’t simply that there are more bots. Automated traffic is growing far faster than human traffic, while even relatively simple attacks continue to evade detection across much of the web. The challenge now is identifying intent, not simply identifying whether traffic is human or automated.